| Copyright © Klaus Piontzik | ||
| German Version |
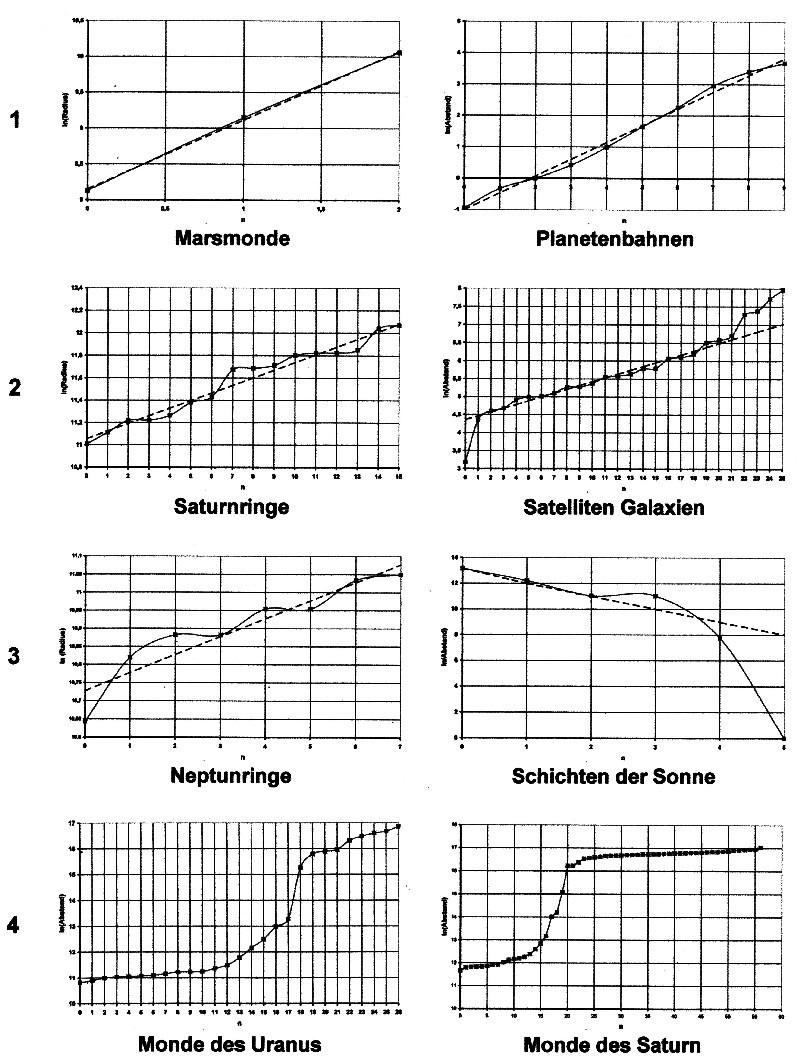
| The given values wk are logarithmized (in a next step). The logarithmic values ?? are presented as a function of the numbering. See the images from Figure 7.1. |

| Illustration 7.1 - Logarithmic values |
|
After the logarithmization, the function must behave at least approximately linearly.
This linearity is a necessary prerequisite for the sequence of n values ??to be converted into an e-function If there are two values, the second value can be moved to any numbering position. This means that no clear straight line can be defined. Only when there are at least three values ??can a clear straight line be extracted. The images in Figure 7.1 show the different forms of functions that can actually occur in logarithmization. line 1An almost perfect linearity of the logarithmic values ??
can be seen in the images of the Martian moons and the planetary orbits.
line 2The image of Saturn's rings shows good linearity of the logarithmic values. The image of the satellite galaxies shows that most of the data already has good
linearity. Only in the short range and in the far range are there different values,
which can then be smoothed out by the subsequent linearization.
line 3The picture of the Neptune rings shows good linearity of the logarithmic values. At first glance, the sun's shells do not look linear.
However, you should note that point 3 is approximately at the same height as point 2,
which does not justify a whole counting step. If point 4 is moved to 5, the linearity
is surprisingly good. This shows that greater linearity can be achieved through approximate numbering.
Interim balance sheetThe linearity of the logarithmic values ??in the examples
from lines 1, 2 and 3 is so good that a strong connection to the e-function can be assumed here.
line 4The staircase-like structure of the moons of Uranus can be clearly seen. The steep climb between points 17 and 18 means nothing other than the existence of a large space between the tracks. For all planets, the orbits of the moons can be split into two parts. In a close range and in a long range. If you separate the two areas and treat them separately, good linearization can also be achieved here. The staircase-like structure of the moons of Uranus can also be clearly seen. Here too, as with Uranus, there is a near and a long range. In contrast to Uranus, moons also exist in the area of ??the gap, so that we can speak of a middle area here. If diagrams appear like those for the moons of Saturn and Uranus, only the data from the close range are initially used. The middle or long range is then obtained by extrapolating the function found. |

|
200 sides, 23 of them in color 154 pictures 38 tables Production und Publishing: ISBN 978-3-7357-3854-7 Price: 25 Euro |