| Copyright © Klaus Piontzik | ||
| German Version |
There are two ways to determine an approximate line from the logarithmic (and linearized) data.
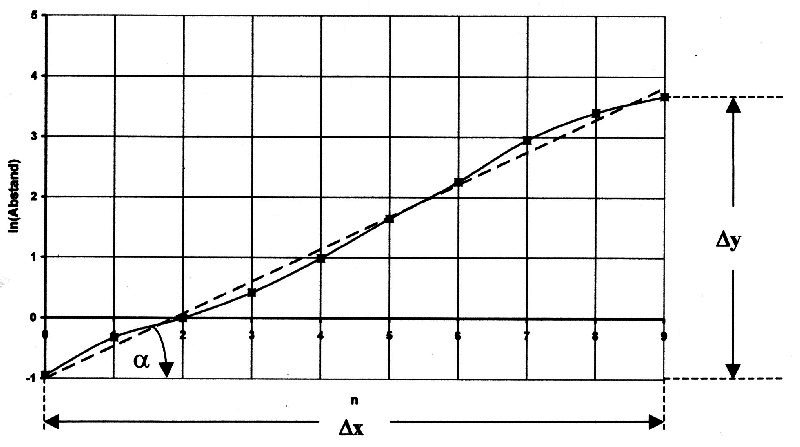
Case b) will be discussed below, since case a) can be handled using a commercially available calculation program. We are now looking for the approximation line y = ax + b for the logarithmic values. In the following figure, the approximation line is shown as a dashed line. |

Illustration 7.2 approximation line
There are n values ??given, namely: y0, y1, y2, ... yk, ... yn
with yk = ln wk
There is a minimum ymin and a maximum ymax
| The slope a of the approximation line can be determined from the min-max values ??and the new approximate numbering. The following applies: |
| 7.4.1 - Equation: |
|
| Δ y is the difference between the minimum and maximum values: |
| 7.4.2 - Equation: |
|
| Δ x is the maximum value of the new numbering: |
| 7.4.3 - Equation: |
|
| The additive constant of the function you are looking for results from the smallest value: |
| 7.4.4 - Equation: |
|
| The following applies to the approximation line: |
| 7.4.5 - Equation: |
|
| Inserting all terms gives: |
| 7.4.6 - Equation: |
|

|
200 sides, 23 of them in color 154 pictures 38 tables Production und Publishing: ISBN 978-3-7357-3854-7 Price: 25 Euro |